By Kathryn Hazelett
Editor’s note: This is one in a series of blog posts to critically examine how poverty is defined, measured, and talked about, and how those conversations influence public policy.
Now that we’ve explored the ins and outs of how we define and measure basic needs, let’s take a look at how we’ve calculated family budgets. Below is a comparison of a family budget in the 1960s with one today. I’m using the Bureau of Labor Statistics data for the 1960s calculation and a calculator from the Economic Policy Institute for today.[1]
For simplification, we’ll look at the percentages — what percentage of income went/goes to items like food, clothing, and housing.
In the 1960s, the breakdown for an urban family with one wage-earner looked like this:
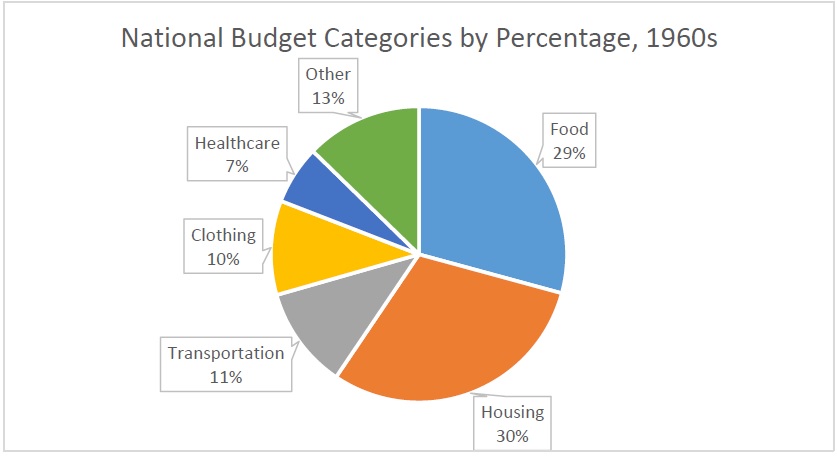
Just as we’ve discussed over the last several weeks, it’s important to look at these amounts with a critical eye. In this case, these numbers represent a “City Worker’s Family Budget for a Moderate Living Standard” and were published in 1966.
Today, the breakdown looks like this:
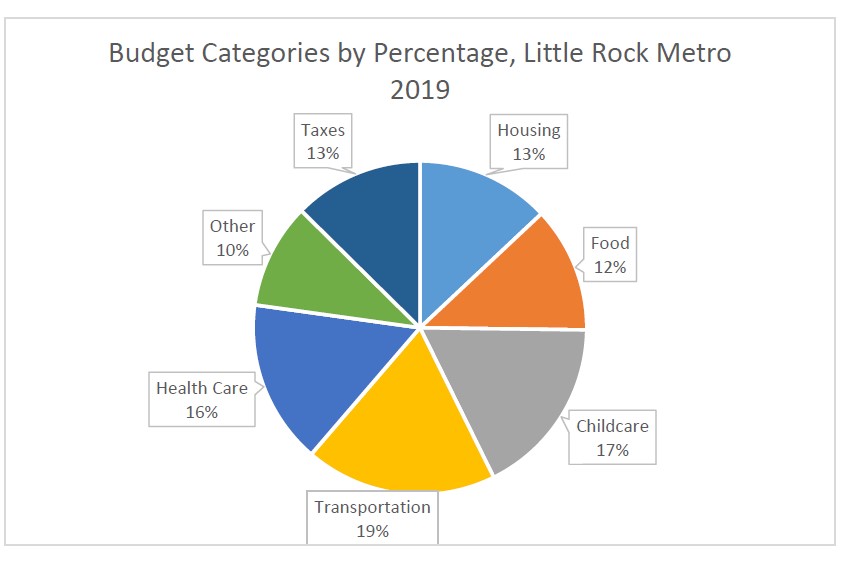
These numbers are for a family of four in the Little Rock, Ark., metro area in 2019.
I’m sure that differences jump out to you. For me, the
inclusion of child care (and its large costs) as well as the big changes in
health care, housing and, of course, food
stand out. Times and categories change. How we budget changes. How we measure
and think about poverty and family needs should change, too.
[1] I encourage you to follow the EPI link and see what you learn about the real costs of meeting our basic needs where you live.