Talking about Poverty: Food Costs in the 1950s
By Kathryn Hazelett
Editor’s note: This is the third in a series of blog posts to critically examine how poverty is defined, measured, and talked about, and how those conversations influence public policy.
I know, I know. We’ve been talking about poverty. Why are we now talking about the cost of food in the 1950s? Well, as it turns out, poverty (at least our measurement of it) and the cost of food in the 1950s are intrinsically linked. How?
Back in the 1960s, there was an employee of the Social Security Administration named Mollie Orshansky. She was tasked with answering a Congressperson’s question about how much money a retired couple would need annually in order to retire. She had studied math and statistics in college and her research on that mythical retired couple’s needs led to more research projects (resulting, among other things, in scaling for family size) and eventually to the official poverty line that we STILL USE today.
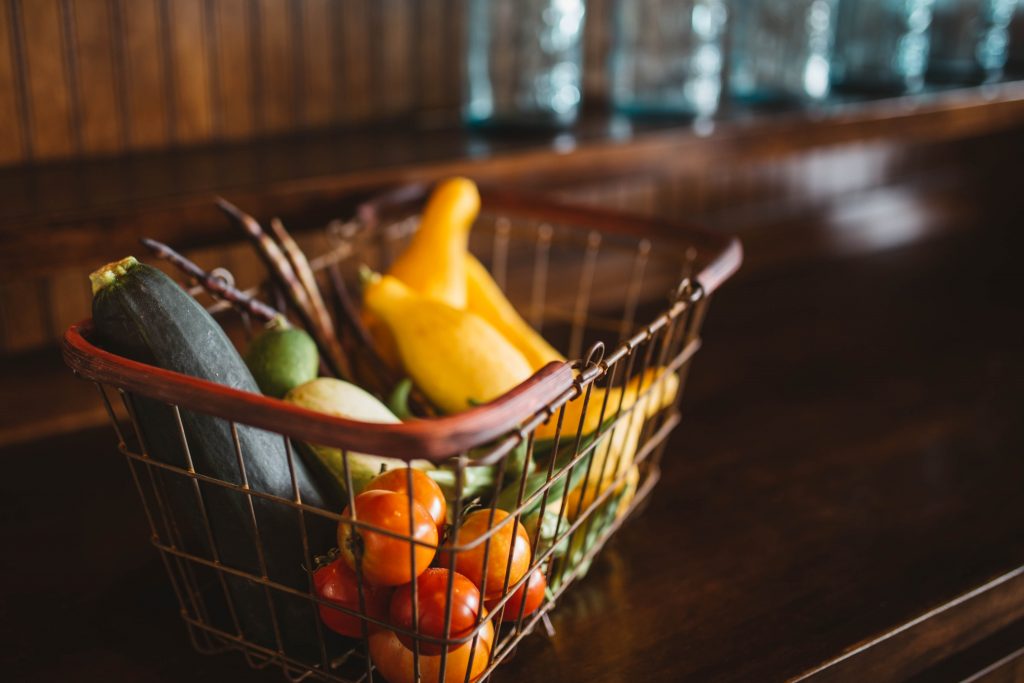
Ms. Orshansky looked at US Department of Agriculture data (she had previously been a researcher at the USDA and was familiar with the data) and discovered that in 1955, the average household with three or more people spent about one-third of its income on food, which meant that about two-thirds of income was spent on everything else. Using the cost of a healthy diet as the basis and multiplying it by three would then give an estimate of the average amount necessary to meet basic needs. Remember basic needs from our earlier discussion on poverty? Here’s where we tie the idea of basic needs to an actual dollar amount.
At that time, the USDA tracked an “economy food plan,” which was the lowest cost, minimally nutritious diet. (Again, this is another spot where how we define needs plays a rather large role.) Mollie took that number, multiplied it by three and – voilá! – she established a basic poverty threshold. This calculation is still the basis of our poverty measurement today, with a revision in 1969 and adjustments made for Hawaii and Alaska.
In the 1960s, this measure was a good approximation of family costs, but the cost of food in the average family’s diet doesn’t cost as much percentage-wise today. Based on the Bureau of Labor Statistics’ 2017 data on consumer expenditures, the cost of food makes up about 12.8 percent of annual income these days. If we stuck with Orshansky’s elegant logic, the cost of food would be multiplied by 7.8 rather than three to determine the cost of basic needs.
The point is that how we measure poverty matters. Having a measure that accurately reflects real family needs (and not just the cost of food in the ‘50s) is a must.
Meet ALICE
By Janie Ginocchio You might be thinking, “I only know one person named ALICE and she’s my 86-year-old great aunt.” That’s surely true, but what’s true, too, is...

Talking about Poverty: Chained CPI
Editor’s note: This is one in a series of blog posts to critically examine how poverty is defined, measured, and talked about, and how those conversations influence public policy....
Talking about Poverty: Inflation Inequality
By James Owen Editor’s note: This is one in a series of blog posts to critically examine how poverty is defined, measured, and talked about, and how those conversations...