In October, the Census Bureau released the poverty rate based on the Supplemental Poverty Measure (SPM). This snapshot of poverty in America, which varies somewhat from the standard official measure released in September, accounts for regional differences in the prices of housing and other local living costs by using more updated formulas associated with consumption patterns and family structures to calculate the rate. It also deducts essential costs—food, clothing, housing, and utilities—and accounts for government assistance programs. This new measure is significant as the official poverty measure (OPM) has been widely assailed because of assumptions such as the income needed to live in San Francisco being the same as what is needed in the Mississippi Delta. Just to clarify and underscore the absurdity of this, the median value of owner-occupied housing units in Clarksdale, Mississippi is $60,000; while in San Francisco, it’s $750,900. Further, the OPM does not incorporate many income supports that effectively lift families out of poverty. Thus, many conclude that the SPM is a more accurate measure of poverty than the OPM.
The SPM shines a new light on the effectiveness of anti-poverty and government assistance programs in tackling poverty. For example, a single mom in Arkansas with two kids can receive an Earned Income Tax Credit (ETIC) of $5,370 if she makes about $13,500 annually, which increases her household income by nearly 40 percent. Including this kind of information in poverty analysis measures paints a more accurate picture of what poverty looks like in the U.S.

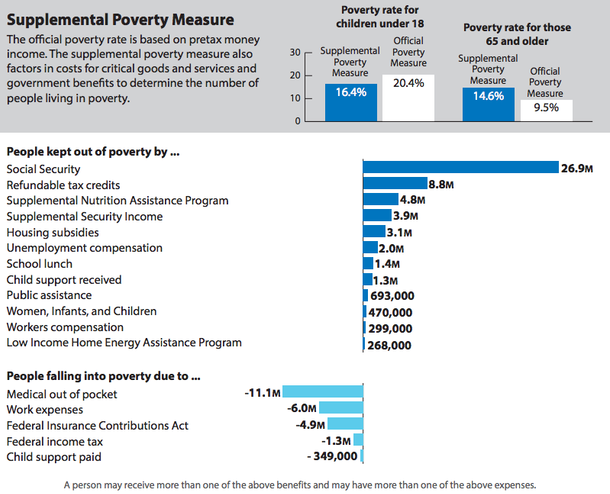
Source: Census Bureau, 2014.
The OPM calculates Arkansas’s poverty rate as 18.7 percent, and Mississippi’s rate as 20.7 percent. Under the SPM, Arkansas’s poverty rate decreases to 16.1 percent, and Mississippi’s declines to 15.3 percent. In summary, the poverty rates in both Arkansas and Mississippi are lower when using the more comprehensive SPM. Further, on the national level, the overall poverty rate over the last five decades remains around 15 percent according the OPM. The SPM, on the other hand, declines markedly over the past fifty years (19 to 16 percent).
| OPM (2011-2013) | SPM (2011-2013) | Difference | |
| Arkansas | 18.7% | 16.1% | -2.65 |
| Mississippi | 20.7% | 15.3% | -5.4% |
| U.S. | 14.9% | 15.9% | 0.9% |
Source: Census Bureau, 2014.
Having an accurate measurement is critical to Southern’s work as we seek to create opportunities for economic stability and mobility in Arkansas and Mississippi. While the SPM does not tell us everything about the communities we serve, it does provide insight into the resources people have access to and the costs they incur by looking at the population in a comprehensive way. To learn more about our efforts to improve economic opportunities for people in rural communities, please contact Meredith Covington, Policy & Communications Manager, at meredith.covington@southernpartners.org.
Census Bureau. (2010).